Specific Strength vs Specific Modulus: Material Selection


Deepak S Choudhary
Lightweight design depends on whether your component fails by breaking or by bending. This guide explains how to use specific strength and specific modulus correctly in real material selection, including Ashby indices, geometry effects, and verified data comparisons.
Download the Specific Strength vs Specific Modulus PDF
Specific strength and specific modulus are screening ratios for lightweight design.
Specific strength (σ/ρ) governs strength-limited parts such as ties or tension members.
Specific modulus (E/ρ) governs stiffness-limited parts such as beams, panels, and struts.
Choosing the wrong ratio causes under- or over-designed sections.
Material selection goes wrong when you compare “good-looking” ratios without a load case. A bracket fails, and everyone blames a low grade. In reality, the bracket was stiffness-limited, not strength-limited. The part did not crack first. It bent, opened a gap, shifted the load path, and then a fastener or weld took a peak load it never saw in the spreadsheet.
Two ratios sit at the center of this problem. One relates strength to density. The other relates stiffness to density. Each ratio is valid, but only inside its correct failure story. You also need to respect geometry because beams, plates, and columns do not scale the same way with material properties.
In practice, I treat these ratios as filters, not final answers. A ratio gets you into a shortlist. After that, you check fatigue, temperature, corrosion, joining, and variability. This article builds that full decision chain, so your next design review has fewer opinions and more physics.
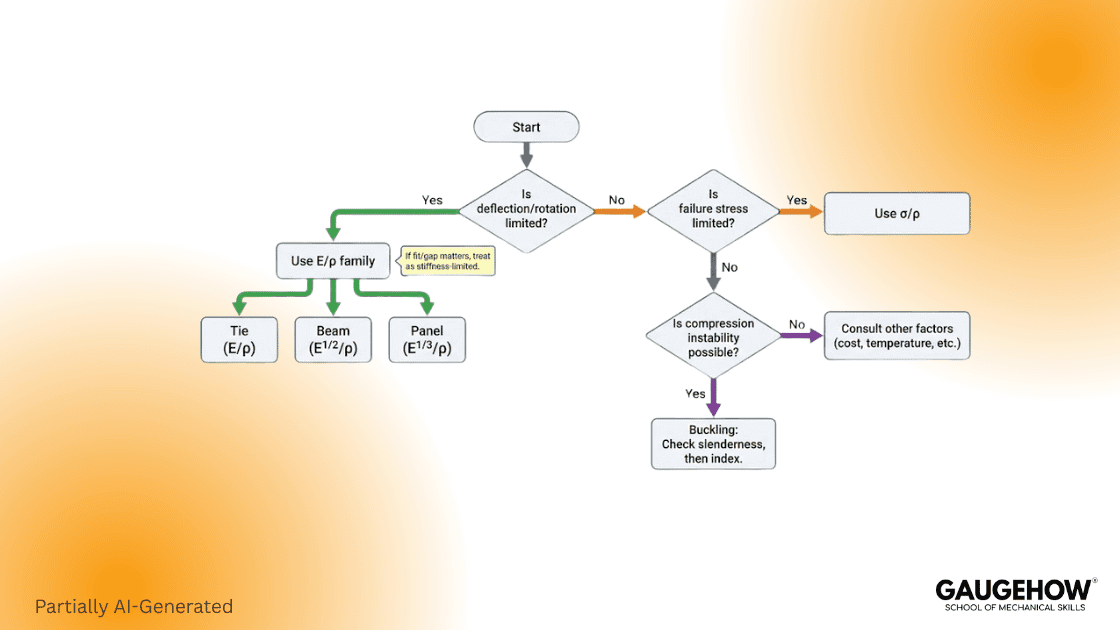
Quick Decision Rule
Use this flow as your decision aid. It keeps you honest when the team starts chasing “lightweight” numbers.
Start
|
|-- Is maximum deflection/rotation a hard requirement?
| |
| |-- YES --> Stiffness-Limited --> Use modulus-to-density style indices
| |
| |-- NO --> Go next
|
|-- Is the first failure governed by yield/ultimate or buckling?
|
|-- Yield/Ultimate --> Strength-Limited --> Use strength-to-density style indices
|
|-- Buckling --> Stiffness + Geometry --> Use stiffness-based buckling indices
One practical shortcut helps. If your drawing has a tight flatness, gap, or alignment tolerance under load, treat it as stiffness-limited. If your drawing has a high proof load and no deflection cap, treat it as strength-limited.
Definitions And Units
Specific strength = Strength ÷ Density.
It expresses how much load a material can take per unit mass and is measured in N·m/kg or kJ/kg.
Used mainly in strength-limited members like rods, bolts, or cables.
Specific modulus (specific stiffness) = Young’s modulus ÷ Density.
It expresses stiffness efficiency per unit mass and is used in stiffness-limited structures like beams or panels.
Units reminder
Modulus in GPa and density in g/cm³ give convenient numeric ratios (GPa·cm³/g).
Always keep consistent units; mixed systems lead to false comparisons.
Units And Quick Conversions
People lose time here, so I keep it strict.
Treat strength-to-density as an energy per-mass figure when you compare candidates. In SI, dividing pascals by kg per cubic metre reduces to N·m per kg, which is J/kg, so handbooks list it as kJ/kg. Log your unit set.
E divided by density has the same unit structure. It is also a form of energy per unit mass, even though you should treat it as a stiffness efficiency, not stored energy.
Two notes prevent classic review-room mistakes:
Keep yield and ultimate apart in your calculations. Datasheets may label “strength” ambiguously; verify which value and criterion.
Always write the source for density. A composite ply, a laminate, and a fiber tow are different materials.
Many tables show modulus in GPa and density in g/cm³ because the ratio gives neat numerics, effectively GPa·cm³/g. Capture the convention in your calc sheet.
That stiffness-per-mass format is acceptable if every candidate is handled in one unit system; spot-check one row.
Ashby Indices Table
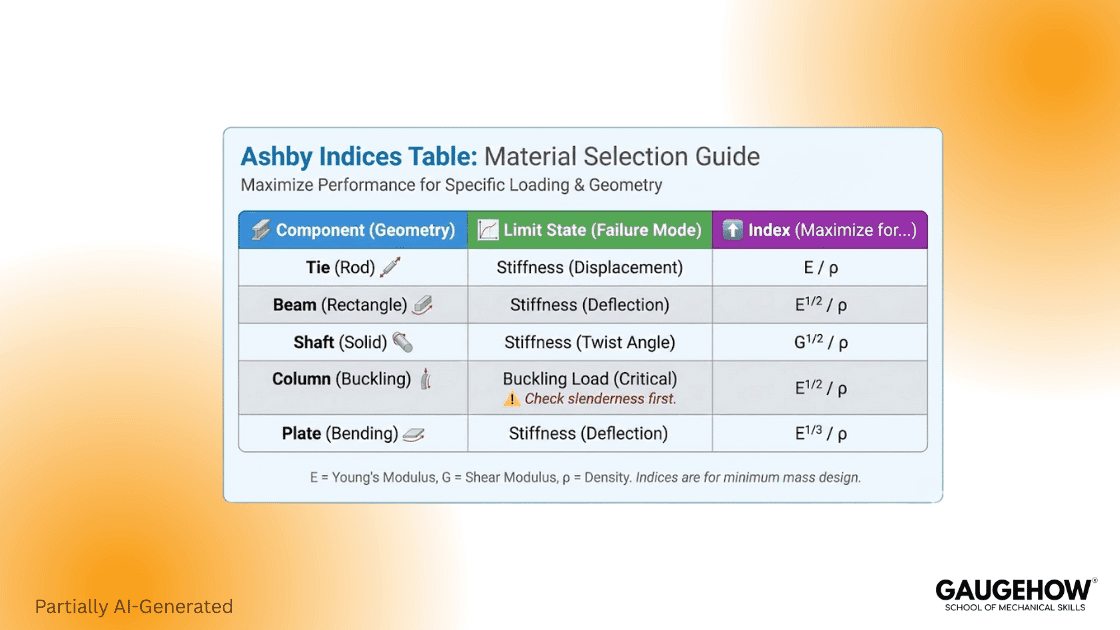
The table below condenses the geometry-complete Ashby approach used in mechanical design selection charts.
Component | Governing Constraint | Index To Maximize (M) | Meaning |
Tie in Tension | Strength-limited | M = σ / ρ | Screens materials when the yield or ultimate stress is the limit. |
Tie in Tension | Stiffness-limited | M = E / ρ | Used when elongation or deflection governs. |
Beam in Bending | Stiffness-limited | M = E^(1/2) / ρ | Reflects that shape freedom changes stiffness scaling. |
Panel in Bending | Stiffness-limited | M = E^(1/3) / ρ | Sandwich and honeycomb panels dominate here. |
Column / Strut | Buckling-limited | Index family (E·geometry) | Geometry dominates; slenderness is checked first. |
How to use it:
Define the limit state: breakage or deflection.
Pick the right geometry row.
Use yield strength for ductile metals; ultimate for brittle ones.
Use E when stiffness or vibration governs.
Record index and property sources in reviews.
Geometry Driven Indices
This is the section most “comparison” articles skip, and it is where real weight gets saved.
A ratio is only a full answer for a specific structural form.
Ties And Rods In Tension
If a straight tie carries axial load and you size it by stress, mass scales with strength divided by density. That is the clean home of the classic strength-to-weight ratio.
If the same tie is sized by extension limit, stiffness matters, and E divided by density becomes the driver.
Beams In Bending
Beams are different becausethe second moment of area moves faster than area when you change shape. For stiffness-limited beams, the classic light stiff objective pushes you toward a square root dependence on E rather than a linear dependence. That is why two metals with similar E/ρ can still behave differently after you change the section architecture.
Plates And Panels
Plates under bending stiffness constraints typically use an even weaker exponent on E. In other words, geometry dominates. That is why honeycomb and sandwich panels beat “better metals” in many stiffness-limited problems.
Buckling Members
Columns and thin shells fail by instability long before yield, especially in compression. Any selection that ignores buckling is incomplete. In buckling limited regimes, stiffness and slenderness couple, so you should treat the material ratio as only half the story.
How We Think Differently
A good material is one that survives the real failure mode with the lowest mass. That statement forces you to write the limit state first. Once the limit state is correct, the material chart usually agrees with your intuition.
Verified Numeric Anchor
NPTEL notes report that the specific stiffness of advanced fibers is ~13× higher and the specific strength ~16× higher than that of structural metals. This explains why composites dominate stiffness-limited aerospace and EV shell design. (Source: NPTEL Materials for Engineers)
Decision Traps
Why Steel and Aluminum Feel Similar in Stiffness per kg
Material | Density (g/cm³) | E (GPa) | E/ρ (GPa·cm³/g) |
Steel | 7.85 | 200 | 25.5 |
6061-T6 Aluminum | 2.70 | 69 | 25.6 |
Despite popular belief, stiffness per mass differs by only ~4-5%. So in stiffness-limited problems, geometry optimization—depth, ribbing, sandwich panels—beats switching alloys.
When Strength Ratios Mislead
A high σ/ρ looks great until the real failure mode is buckling, bearing, or fatigue. Always identify the limit state before screening.
Buckling Members Need Slenderness First
For columns and shells, the slenderness ratio and end constraints decide the load first. The stiffness index only screens materials after geometry stabilizes.
Material Comparisons
Material | Density (g/cm³) | Yield (MPa) | E (GPa) | σ/ρ | E/ρ |
A36 Steel | 7.85 | 250 | 200 | 31.8 | 25.5 |
6061-T6 Al | 2.70 | 276 | 68.9 | 102 | 25.5 |
Ti-6Al-4V | 4.43 | 827 | 114 | 187 | 25.7 |
Mg AZ31B | 1.77 | 200 | 44.8 | 113 | 25.3 |
Carbon Fiber (T300) | 1.76 | 3530 | 230 | 2006 | 131 |
Interpretation:
Most metals cluster near E/ρ ≈ 25, so stiffness per mass stays flat.
Composites jump 4–5× in stiffness per mass and ~16× in strength per mass.
If stiffness limits, composites win. If strength limits, titanium or high-Mg alloys excel.
Worked Comparison With Real Materials
Below is a compact, traceable comparison using commonly referenced grades and datasheets.
Input Properties
ASTM A36 steel: density 7.85 g/cm³, yield 250 MPa, modulus 200 GPa (AZoM)
6061 T6 aluminum: density 2.70 g/cc, yield 276 MPa, modulus 68.9 GPa (gabrian.com)
Ti 6Al 4V: density 4.43 g/cc, yield (0.2% offset, min) 827 MPa, modulus 114 GPa (maher.com)
Magnesium AZ31B: density 1.77 g/cm³, yield (0.2% offset) 200 MPa, modulus 44.8 GPa (AZoM)
Carbon fiber T300 (fiber): density 1.76 g/cm³, tensile strength 3530 MPa, tensile modulus 230 GPa
Computed Ratios (Same Units Across All)
Stiffness efficiency (E/ρ):
A36: 200 / 7.85 ≈ 25.5
6061 T6: 68.9 / 2.70 ≈ 25.5
Ti 6Al 4V: 114 / 4.43 ≈ 25.7
AZ31B: 44.8 / 1.77 ≈ 25.3
T300 fiber: 230 / 1.76 ≈ 131
This result is the punchline many teams need to hear: most common structural metals cluster around the same stiffness per weight. (Stanford Advanced Materials)
If your part is stiffness-limited, changing steel to aluminum often does less than people expect unless you also change section geometry.
Strength efficiency (strength/ρ, using yield for metals):
A36: 250 / 7.85 ≈ 31.8
6061 T6: 276 / 2.70 ≈ 102
Ti 6Al 4V: 827 / 4.43 ≈ 187
AZ31B: 200 / 1.77 ≈ 113
T300 fiber (tensile): 3530 / 1.76 ≈ 2006
Now the pattern flips. Strength per weight varies a lot, especially once you include high-performance alloys and fibers. (AZoM)
What This Means In Design Terms
If your component is strength-limited, titanium can reduce mass even when modulus per weight is not impressive.
If your component is stiffness-limited, a metal swap alone is rarely a breakthrough. In that case, you usually need either a composite, a sandwich concept, or a geometry change that raises bending stiffness faster than mass.
That is also why the specific strength formula belongs in your early screening notes, not at the end. Use it to rule out obvious losers, then move to geometry-specific indices.
Mini Calculator and Download
Inputs
Strength σ (MPa)
Modulus E (GPa)
Density ρ (kg/m³ or g/cm³)
Outputs
Specific Strength = σ / ρ
Specific Modulus = E / ρ
Beam Index = E^(1/2)/ρ
Panel Index = E^(1/3)/ρ
Use it during concept screening, then verify the real limiter (fatigue, temperature, joints).
Download the Specific Strength vs Specific Modulus Index Card
Common Pitfalls And Practical Shortlists
Pitfalls I See In Real Builds
Confusing material stiffness with part stiffness. A high modulus does not save a poor section design.
Avoid hidden permanent set and drifting fits: when yield is the limit, size to yield, not ultimate strength.
Ignoring compression failure in composites. Tensile strength looks great, but compressive and shear allowables often govern joints and bearing.
Skipping buckling checks. Thin members fail by instability first in many lightweight programs.
Practical Shortlists By Problem Type
For fast early selection, I use shortlists like this and then validate with real allowables.
Choose a joinable, affordable metal, then run the deflection check. E/ρ shifts little across alloys, so section geometry carries you. If deflection still fails, move to composite or sandwich and verify buckling.
To minimize mass, aluminum or magnesium can beat mild steel, but fatigue and corrosion control are the gate. Titanium pays off when temperature or corrosion forces high safety factors; track crack growth.
Here is the sanity check I enforce in reviews: show one table with load case, limit state, and the chosen index. If that line is missing, the ratio comparison is noise.
Also, remember why searchers keep typing “strength to weight ratio” into Google. They are looking for a shortcut, so give them one, but keep the failure mode honest.
FAQ
1) When should I prioritize specific modulus over strength ratios?
Prioritize it when deflection, vibration, or alignment is the first failure condition. That choice is usually driven by requirements like gap, stiffness, or eigenfrequency limits. (Stanford Advanced Materials)
2) Why do steels and aluminum feel similar in terms ofstiffness per weight?
Their elastic modulus rises with density for most structural metals, so E divided by ρ changes little between families. Run quick grade numbers, and you will see the spread is modest.
3) What is the biggest mistake with composites in ratio comparisons?
People use fiber tensile numbers as if the structure is isotropic. Real laminates must be checked in shear, compression, bearing, and with manufacturing variability.
4) How do I report ratios cleanly in a design review?
State the load case, state the limit state, then show the ratio used for screening and the property source. Without that chain, the comparison cannot be audited.
5) Do “units” matter if I only compare materials?
The label is secondary; consistent inputs are the requirement. Keep modulus and density in one unit system, and flag temperature and temper. Avoid mixing datasheets and handbooks without a note.
References
AZoM, ASTM A36 steel properties (density, yield, modulus) (AZoM)
Gabrian, 6061 T6 properties (density, yield, modulus) (gabrian.com)
Maher, Ti 6Al 4V datasheet (density, yield, modulus) (maher.com)
AZoM, Magnesium AZ31B properties (density, yield, modulus) (AZoM)
Toray, T300 technical data sheet (density, tensile modulus, tensile strength)
University of Cambridge, material selection charts hub (chart approach, specific stiffness vs specific strength chart) (Materials Engineering Cambridge)
CAD-CAM-CAE Work Platform
Find or Post CAD, CAM and CAE freelance projects, full-time jobs and Internships.
GaugeHow is the platform built for core engineering work. Whether you need a freelancer for a CAD project, a full-time hire, or an engineering intern,post it here and get matched with the right person.
Our Courses
Complete Course Library
Access to 40+ courses covering various fields like Design, Simulation, Quality, Manufacturing, Robotics, and more.