Engineering Mechanics
Graphical Method of Finding the Resultant Force
Before calculators existed, bridges and cranes were still designed correctly. Engineers found their answers with a scale, a set square and a sharp pencil.
That is the graphical method: draw the forces to scale, join them the right way, and measure the answer straight off the paper. It is slower than calculating, but it shows you something numbers never will, which is what a force system actually looks like.
This guide covers how the graphical method works, the head to tail rule, the triangle, parallelogram and polygon laws, how to choose a scale, what space and vector diagrams are, and where the method still earns its place today. Plain language, worked constructions, no steps skipped.
What Is the Graphical Method of Forces?
The graphical method finds the resultant of a force system by drawing each force as an arrow of the correct length and direction, joining them in sequence, and measuring the single arrow that closes the figure.
Two properties of a force get turned into two properties of a line:
Magnitude becomes the length of the line, set by a chosen scale
Direction becomes the angle of the line, drawn with a protractor
That is the whole idea. A 200 N force at 40 degrees becomes a 4 cm line at 40 degrees, if your scale is 1 cm to 50 N. Once every force is a line, combining them is a drawing problem rather than a trigonometry problem.
The everyday version is a treasure map. Walk 30 paces north, then 40 paces east. Nobody calculates the diagonal. You just draw the two legs and see where you ended up compared with where you started. Forces combine in exactly the same way.
Why Forces Can Be Added by Drawing
Forces are vectors, and vectors follow one specific addition rule that lines on paper naturally obey.
When you place the tail of one arrow at the head of the previous one, the path from the very first tail to the very last head represents the combined effect. That is true whichever order you draw them in, which is worth testing once because it surprises most students.
Two consequences fall straight out of this:
The closing arrow from the first tail to the last head is the resultant
If the figure closes on its own, with the last head landing on the first tail, the resultant is zero and the body is in equilibrium
That second point is the most useful thing in this entire topic. A closed force diagram means balance. You can see it before you calculate anything.
How to Choose a Scale
The scale decides whether your answer is trustworthy, so pick it before you draw anything.
Choose a scale that makes your largest force a comfortable length, ideally somewhere between 6 cm and 12 cm. Too small and small differences vanish. Too large and the drawing runs off the page.
Some sensible choices:
Forces up to 100 N: use 1 cm = 10 N
Forces up to 500 N: use 1 cm = 50 N
Forces up to 5 kN: use 1 cm = 500 N
Write the scale on the drawing itself, in the form 1 cm = 50 N. It is worth marks in exams, and more importantly it stops you converting the final measurement with the wrong number twenty minutes later.
Keep the scale identical for every force in the diagram. Mixing scales is the fastest way to a completely wrong answer that still looks tidy.
The Head to Tail Rule
This is the single technique behind every graphical construction you will meet.
Draw the first force to scale, with its correct angle.
Start the second force at the head of the first, keeping its own correct angle and length.
Continue for every remaining force, each one starting where the previous one ended.
Draw an arrow from the tail of the first force to the head of the last force. That closing arrow is the resultant.
Measure its length, convert with your scale, and measure its angle with a protractor.
Two points that catch people out. The arrows must keep their original directions, since you are moving them but never rotating them. And the resultant arrow points from start to finish, which is the opposite sense to the way you travelled around the figure.
Worked construction
Three forces act at a point: 40 N east, 30 N at 60 degrees, and 25 N at 150 degrees.
Choose 1 cm = 10 N.
Draw 4.0 cm horizontally to the right.
From its head, draw 3.0 cm at 60 degrees.
From that head, draw 2.5 cm at 150 degrees.
Join the original starting point to the final head. Measure about 6.6 cm at roughly 45 degrees.
Convert: 6.6 × 10 = 66 N at about 45 degrees.
Check it against the calculation and you get 65.9 N at 44.7 degrees. A careful drawing lands within one or two percent, which tells you the method is sound but the pencil is the weak link.
Triangle Law of Forces
The triangle law of forces states that if two forces acting at a point are represented in magnitude and direction by two sides of a triangle taken in order, then the third side taken in the opposite order represents their resultant.
It is simply the head to tail rule with exactly two forces. Draw the first, draw the second from its head, and the line closing the triangle is your answer.
Taken in order means head to tail, following the direction of travel. The closing side runs the other way, from the start point back to the finish point.
There is an important companion result. If three forces acting at a point can be drawn as a triangle that closes completely, their resultant is zero and the body is in equilibrium. This is called the triangle law of equilibrium, and it is the drawing-based partner of Lami's Theorem.
Engineers use it constantly for quick joint checks in roof trusses, tent guy wires and three-rope lifting arrangements. If the triangle closes, the joint balances.
Parallelogram Law of Forces
The parallelogram law states that if two forces acting at a point are represented by the two adjacent sides of a parallelogram, then their resultant is represented by the diagonal drawn from that same point.
The difference from the triangle law is only in how you draw it. Here both forces start from the same point rather than being joined head to tail. You then complete the parallelogram with two light construction lines and draw the diagonal.
The construction goes like this:
Draw both forces to scale from the same starting point, at their correct angles.
From the head of the first force, draw a light line parallel to the second force.
From the head of the second force, draw a light line parallel to the first.
Those two lines cross at the far corner.
Draw the diagonal from the starting point to that corner. Measure it and convert.
Real-life picture: two tugboats pulling one ship with ropes spreading outward. The ship travels along a path between the two ropes, and that path is the diagonal.
Both laws give identical answers, so use whichever suits the drawing. The parallelogram construction is clearer when both forces genuinely act from the same physical point, such as a hook or a bolt.
Polygon Law of Forces
The polygon law of forces extends the same idea to any number of forces. It states that if several forces acting at a point are represented in magnitude and direction by the sides of a polygon taken in order, then the resultant is represented by the closing side taken in the opposite order.
Two forces make a triangle. Four forces make a quadrilateral. Six make a hexagon. The rule never changes, only the number of sides.
The key insight is what happens when there is no gap left. If the polygon closes by itself, the resultant is zero and the system is in equilibrium.
This gives engineers a purely visual balance test. Draw the forces at a joint head to tail. If the last arrow lands exactly on the first starting point, the joint is balanced. If there is a gap, the body will accelerate in the direction of that gap, and the size of the gap tells you how strongly.
An open polygon of 1.2 cm at a scale of 1 cm = 100 N means an unbalanced force of about 120 N. You have both the direction and the magnitude of the problem without writing a single equation.
Space Diagram and Vector Diagram
Graphical work uses two separate drawings, and mixing them up is a common source of confusion.
The space diagram shows the physical arrangement. Where the crane sits, where the ropes attach, what angle the ramp makes. It shows position and geometry, but the arrow lengths mean nothing here.
The vector diagram, also called the force diagram, shows only the forces drawn to scale, head to tail. It carries no information about position at all. A force acting at the top of a mast and one acting at its base look identical in a vector diagram if they have the same magnitude and direction.
Keep them side by side on the page. Read the angles off the space diagram, then transfer them into the vector diagram to get magnitudes. Trying to do both jobs in one drawing is how students end up with beautiful diagrams that answer nothing.
Bow's Notation
Bow's notation is a labelling system that keeps large force diagrams organised, and it is standard in truss work.
In the space diagram, label the spaces between the forces with capital letters going clockwise: A, B, C and so on. Each force then gets named by the two spaces it separates, so the force between space A and space B is force AB.
In the vector diagram, the corresponding points are labelled with lowercase letters, so force AB is drawn as the line from a to b.
The payoff appears when you have eight or ten forces in a truss joint. Every force has an unambiguous name, every line in the vector diagram has a matching endpoint, and you can trace any member without counting arrows. It looks fussy on a three-force problem and becomes indispensable on a twelve-force one.
Graphical Method vs Analytical Method
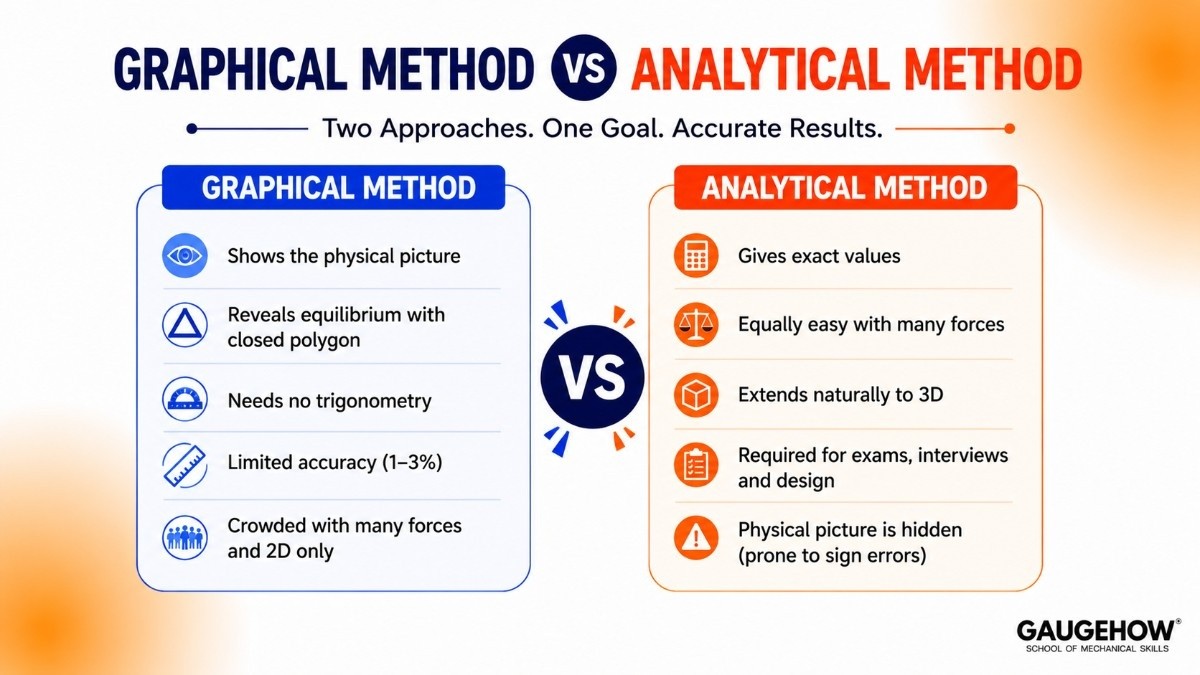
Both give the same answer when done carefully, but they are good at different things.
The graphical method:
Shows the physical picture, so you can see the direction before measuring it
Reveals equilibrium instantly through a closed polygon
Needs no trigonometry beyond reading a protractor
Is limited by pencil thickness and ruler accuracy, typically one to three percent
Becomes crowded with many forces and cannot handle three dimensions on flat paper
The analytical method:
Gives exact values, limited only by your calculator
Stays equally easy with twenty forces as with two
Extends naturally into three dimensions
Is what exams, interviews and design calculations expect
Hides the physical picture, so quadrant and sign errors slip through unnoticed
The professional habit is to use both together. Sketch the force polygon roughly to see which way the answer should point, then calculate analytically for the number you would sign off. The sketch catches the errors that the arithmetic cannot see.
Where the Graphical Method Is Still Used
It is not just an exam exercise, though it does appear in exams regularly.
Quick site checks. A rigger sketching sling angles on a job sheet gets an answer in a minute without opening a laptop.
Verifying software output. A rough polygon tells you instantly whether a simulation result is the right order of magnitude and pointing the right way.
Truss analysis. Maxwell diagrams, built entirely from Bow's notation, solve every member force in a truss in one connected drawing.
Teaching and intuition. Nothing builds a feel for how forces combine like watching a polygon fail to close.
Use it to understand and to check. Use numbers to design.
Common Mistakes in Graphical Solutions
Forgetting to write the scale. Without it the drawing is just a picture, and you cannot convert your measurement back.
Changing scale partway through. Every force in one diagram must use the same scale.
Rotating an arrow while moving it. When you shift a force to a new starting point, its angle must stay identical.
Drawing the resultant the wrong way round. It runs from the first tail to the last head, against the direction you travelled.
Measuring the angle from the wrong line. State clearly whether the angle is from the horizontal or from one of the forces.
Using a blunt pencil. A thick line at a scale of 1 cm = 100 N can be worth 20 N of error on its own.
Mixing up the space and vector diagrams. Angles come from one, magnitudes from the other.
Key Takeaways
The graphical method represents each force as a line whose length is its magnitude and whose angle is its direction.
Always choose and clearly write a scale before drawing anything.
The head to tail rule is the basis of every construction in this topic.
The resultant is the closing arrow from the first tail to the last head.
Triangle law handles two forces, parallelogram law handles two forces from a common point, polygon law handles any number.
A closed force polygon means zero resultant, which means equilibrium.
Space diagrams give geometry, vector diagrams give magnitudes. Keep them separate.
Accuracy is limited by your drawing, so use graphical work to check and analytical work to design.
Quick Revision Box
Scale format: 1 cm = X newtons, written on every diagram
Head to tail rule: each force starts where the previous one ends
Resultant: closing line from first tail to last head
Triangle law: two forces as two sides, resultant is the third side in the opposite order
Parallelogram law: two forces as adjacent sides, resultant is the diagonal from the same point
Polygon law: many forces in order, resultant is the closing side in the opposite order
Equilibrium condition: the force polygon closes with no gap
Bow's notation: spaces labelled A, B, C in the space diagram, points a, b, c in the vector diagram
Typical accuracy: within about one to three percent of the calculated value
Frequently Asked Questions
What is the graphical method of finding the resultant force?
It is a method where each force is drawn as an arrow to a chosen scale, the arrows are joined head to tail, and the arrow closing the figure represents the resultant. Its length gives the magnitude and its angle gives the direction.
Is the graphical method accurate enough for real engineering?
For checks and estimates, yes, since a careful drawing lands within a few percent. For anything you would sign off on, use the analytical method, because ruler accuracy is not design accuracy.
What is the difference between the triangle law and the parallelogram law?
They give the same answer and differ only in construction. The triangle law joins the two forces head to tail, while the parallelogram law draws both from a common point and uses the diagonal.
How do I know if forces are in equilibrium from a drawing?
Draw them head to tail. If the last arrow ends exactly where the first one started, so the polygon closes with no gap, the resultant is zero and the body is in equilibrium.
Why is Bow's notation used?
To keep track of many forces without confusion. Labelling the spaces between forces means every force has a unique two-letter name that matches its line in the vector diagram, which matters once a joint has more than three or four members.
Practice Corner
Why must the same scale be used for every force in one vector diagram?
Three forces are drawn head to tail and the polygon closes exactly. What does that tell you?
At a scale of 1 cm = 25 N, how long should a 175 N force be drawn?
State the difference between a space diagram and a vector diagram in one sentence each.
Two forces of 60 N and 80 N act at right angles. Sketch them head to tail and predict the resultant before measuring.
Answers
Because the lengths are only meaningful relative to each other. A different scale on one force would misrepresent its size compared with the rest, giving a wrong closing line.
The resultant is zero, so the three forces are in equilibrium and the body will not accelerate.
175 ÷ 25 = 7.0 cm.
The space diagram shows the physical layout and the true angles of the arrangement. The vector diagram shows only the forces drawn to scale head to tail, with no positional meaning.
The head to tail construction forms a right-angled triangle, so the closing side is √(60² + 80²) = 100 N, at tan α = 80/60, giving 53.1 degrees from the 60 N force.
Where to Practise This Further
Graphical work rewards repetition, since accuracy comes from technique rather than talent. Drill resultant and equilibrium questions with the free MCQ practice tests, and see how these constructions get asked in placement rounds in the engineering interview question bank.
Modern software has turned these constructions into solvers, and it is worth seeing the connection. The Fusion 360 course shows how load directions are set up on a model, and the FEA with ANSYS course carries the same vector logic into full static structural analysis. If you would rather generate force diagrams from code, Python for Mechanical Engineers covers plotting and calculating them together.
Students planning a design career can also browse the Mechanical Engineer hub and the Design Engineer track to see where statics fits into the wider skill set.
Internal links:
Analytical method of finding the resultant force
Resultant force formula and examples
Rectangular components of a force explained simply
Practice tests: https://gaugehow.com/practice
Interview Q&A hub: https://gaugehow.com/interview