What is a Surface Roughness Tester? Contact vs Non-Contact

A surface roughness tester is a metrology instrument that measures micro-scale surface texture using a stylus trace or an optical scan. It produces a profile or 3D map and converts it into parameters like Ra, Rz, Rp, and Rv so you can make acceptance calls and control the process.
In inspection, the real argument is rarely “what is roughness.” It’s when roughness turns into waviness, and that depends on scale and functional length.
A surface roughness tester gives you a trace or surface map, then converts it into parameters you can accept and trend. Problems start when the method doesn’t suit the surface, or the record is too thin for QA to repeat under the same settings and direction.
Choosing the Tester Route
Inspection route | Mechanism | Best benefit | Common time-waster | Report proof to record |
Stylus contact check | Tip traces a set length and builds a filtered profile | Reliable acceptance of accessible machined metals | Soft coatings, fragile edges, and narrow features trigger rechecks | Location plan, trace direction, cutoff/filter snapshot, stylus condition note |
Optical non-contact check | Light-based scan creates an area map without touching | Delicate textures and micro features with no contact risk | Reflective or transparent behavior swings results | Area size, mode used, surface condition note, settings snapshot |
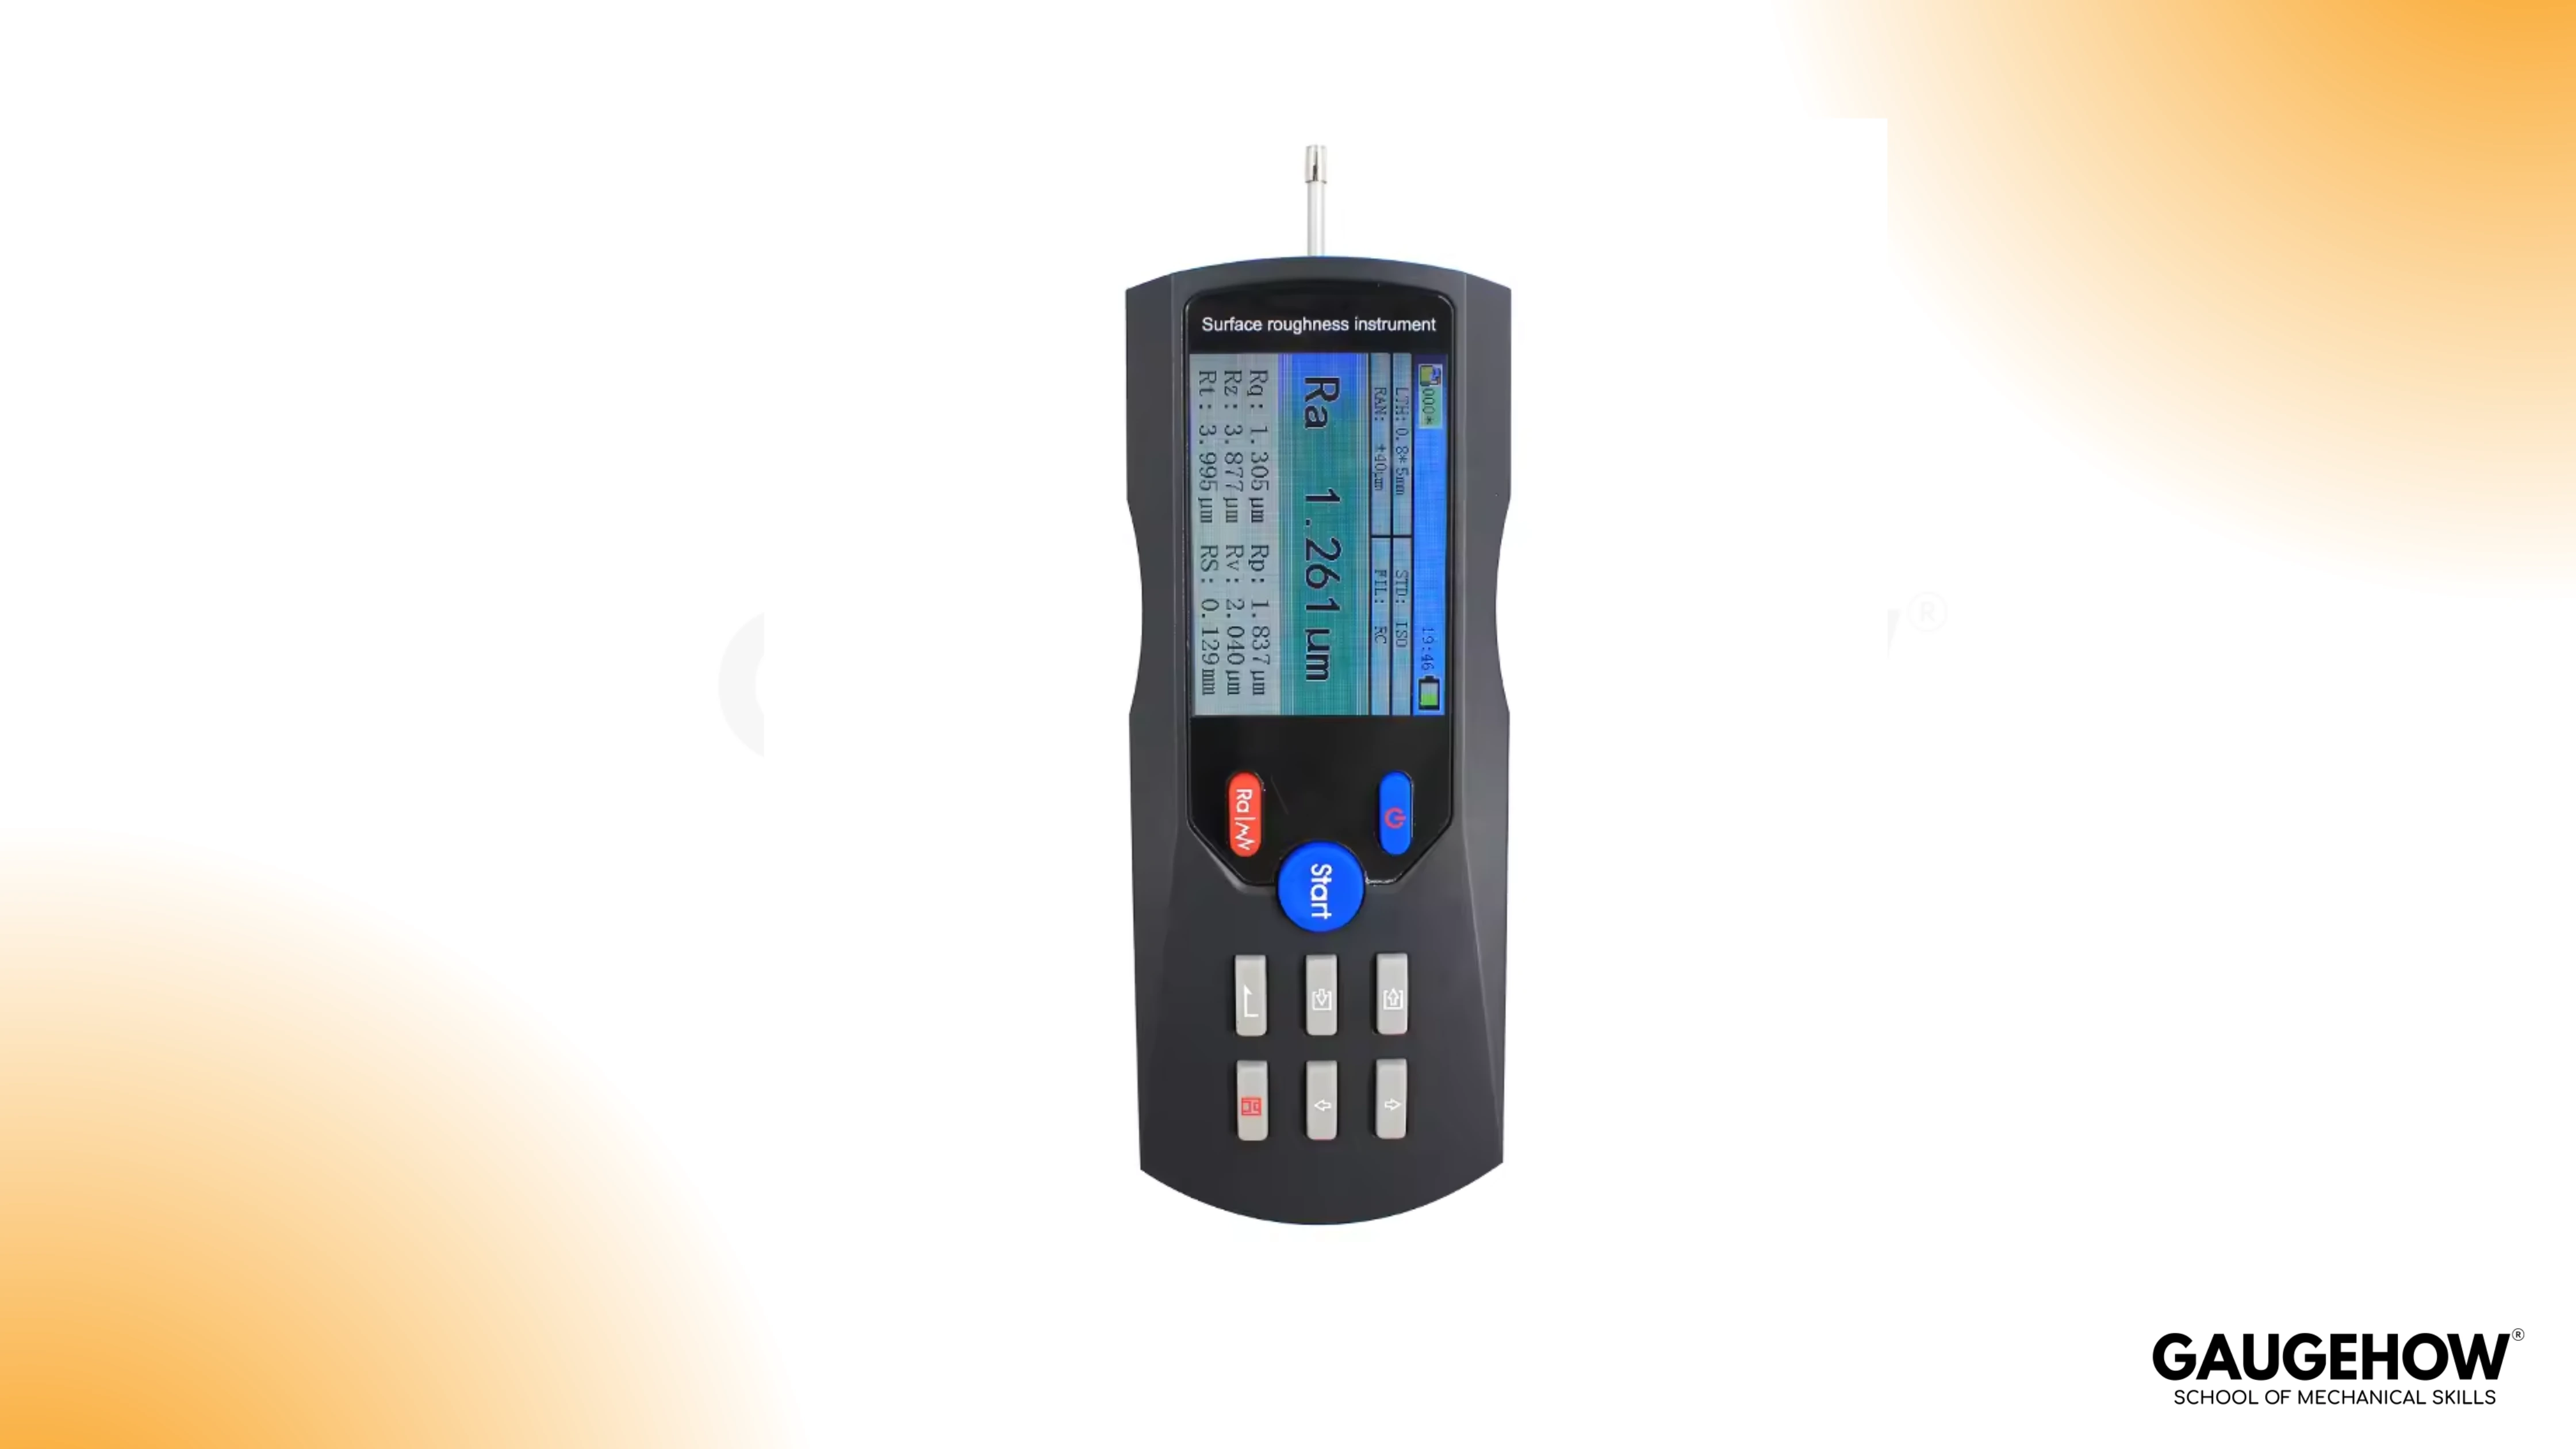
Portable screening route | The handheld unit gives quick traces near the machine | Fast feedback close to the process | One spot hides variability, then QA rejects the lot | Sampling plan, number of traces, locations, direction note, settings snapshot |
Bench investigation route | Fixtured setup improves repeatability for deep analysis | Tight-tolerance diagnosis and dispute resolution | Setup time climbs when the plan is vague | Fixturing note, trace strategy, environment note, settings snapshot |
A workable framework for the whole page is the Roughness Decision Chain: Deliverable → Constraint → Method → Parameter → Record. It keeps decisions consistent when pressure rises.
Contact vs Non-Contact
In inspection, a stylus trace behaves like a physical witness. On a turned shaft with open access, contact measurement tends to repeat well because the sensor is literally following the profile.
False rejection appears when the stylus cannot travel the feature cleanly, or when the surface deforms, snags, or smears under contact.
On a fragile coating, a polished cosmetic face, or a feature with tight access, optical measurement removes the contact interaction, but it introduces a different interaction.
Optical returns depend on surface reflectivity, transparency, and how the instrument interprets what it “sees.” Drift shows up when two people use different optical modes, different areas, or different surface condition assumptions.
That is why contact vs non-contact surface roughness measurement is a risky decision. The method should be chosen by constraint, not preference. Once the constraint is clear, the rest follows through the Roughness Decision Chain.
A usable framework for the whole page is the Roughness Decision Chain: Deliverable → Constraint → Method → Parameter → Record.
Mechanics That Change the Number
A stylus system converts vertical tip motion into an electrical signal through a transducer, then filters and evaluates that signal to calculate roughness parameters.
A different travel direction or a different setting changes which portion of the profile gets emphasized, even when the part is unchanged. Optical systems do not “feel” the surface.
They interpret reflected or scattered light to reconstruct height data over an area, then compute the same family of parameters from that surface model.
Surface condition and optical behavior matter more here because light interaction can shift with films, oxidation haze, or reflectivity.
Surface Roughness Tester Types
In plant terms, “type” should tell you what job gets done without rework. Four common types cover most decisions, and each one carries a predictable failure mode when the record is weak.
1. Portable Stylus Tester
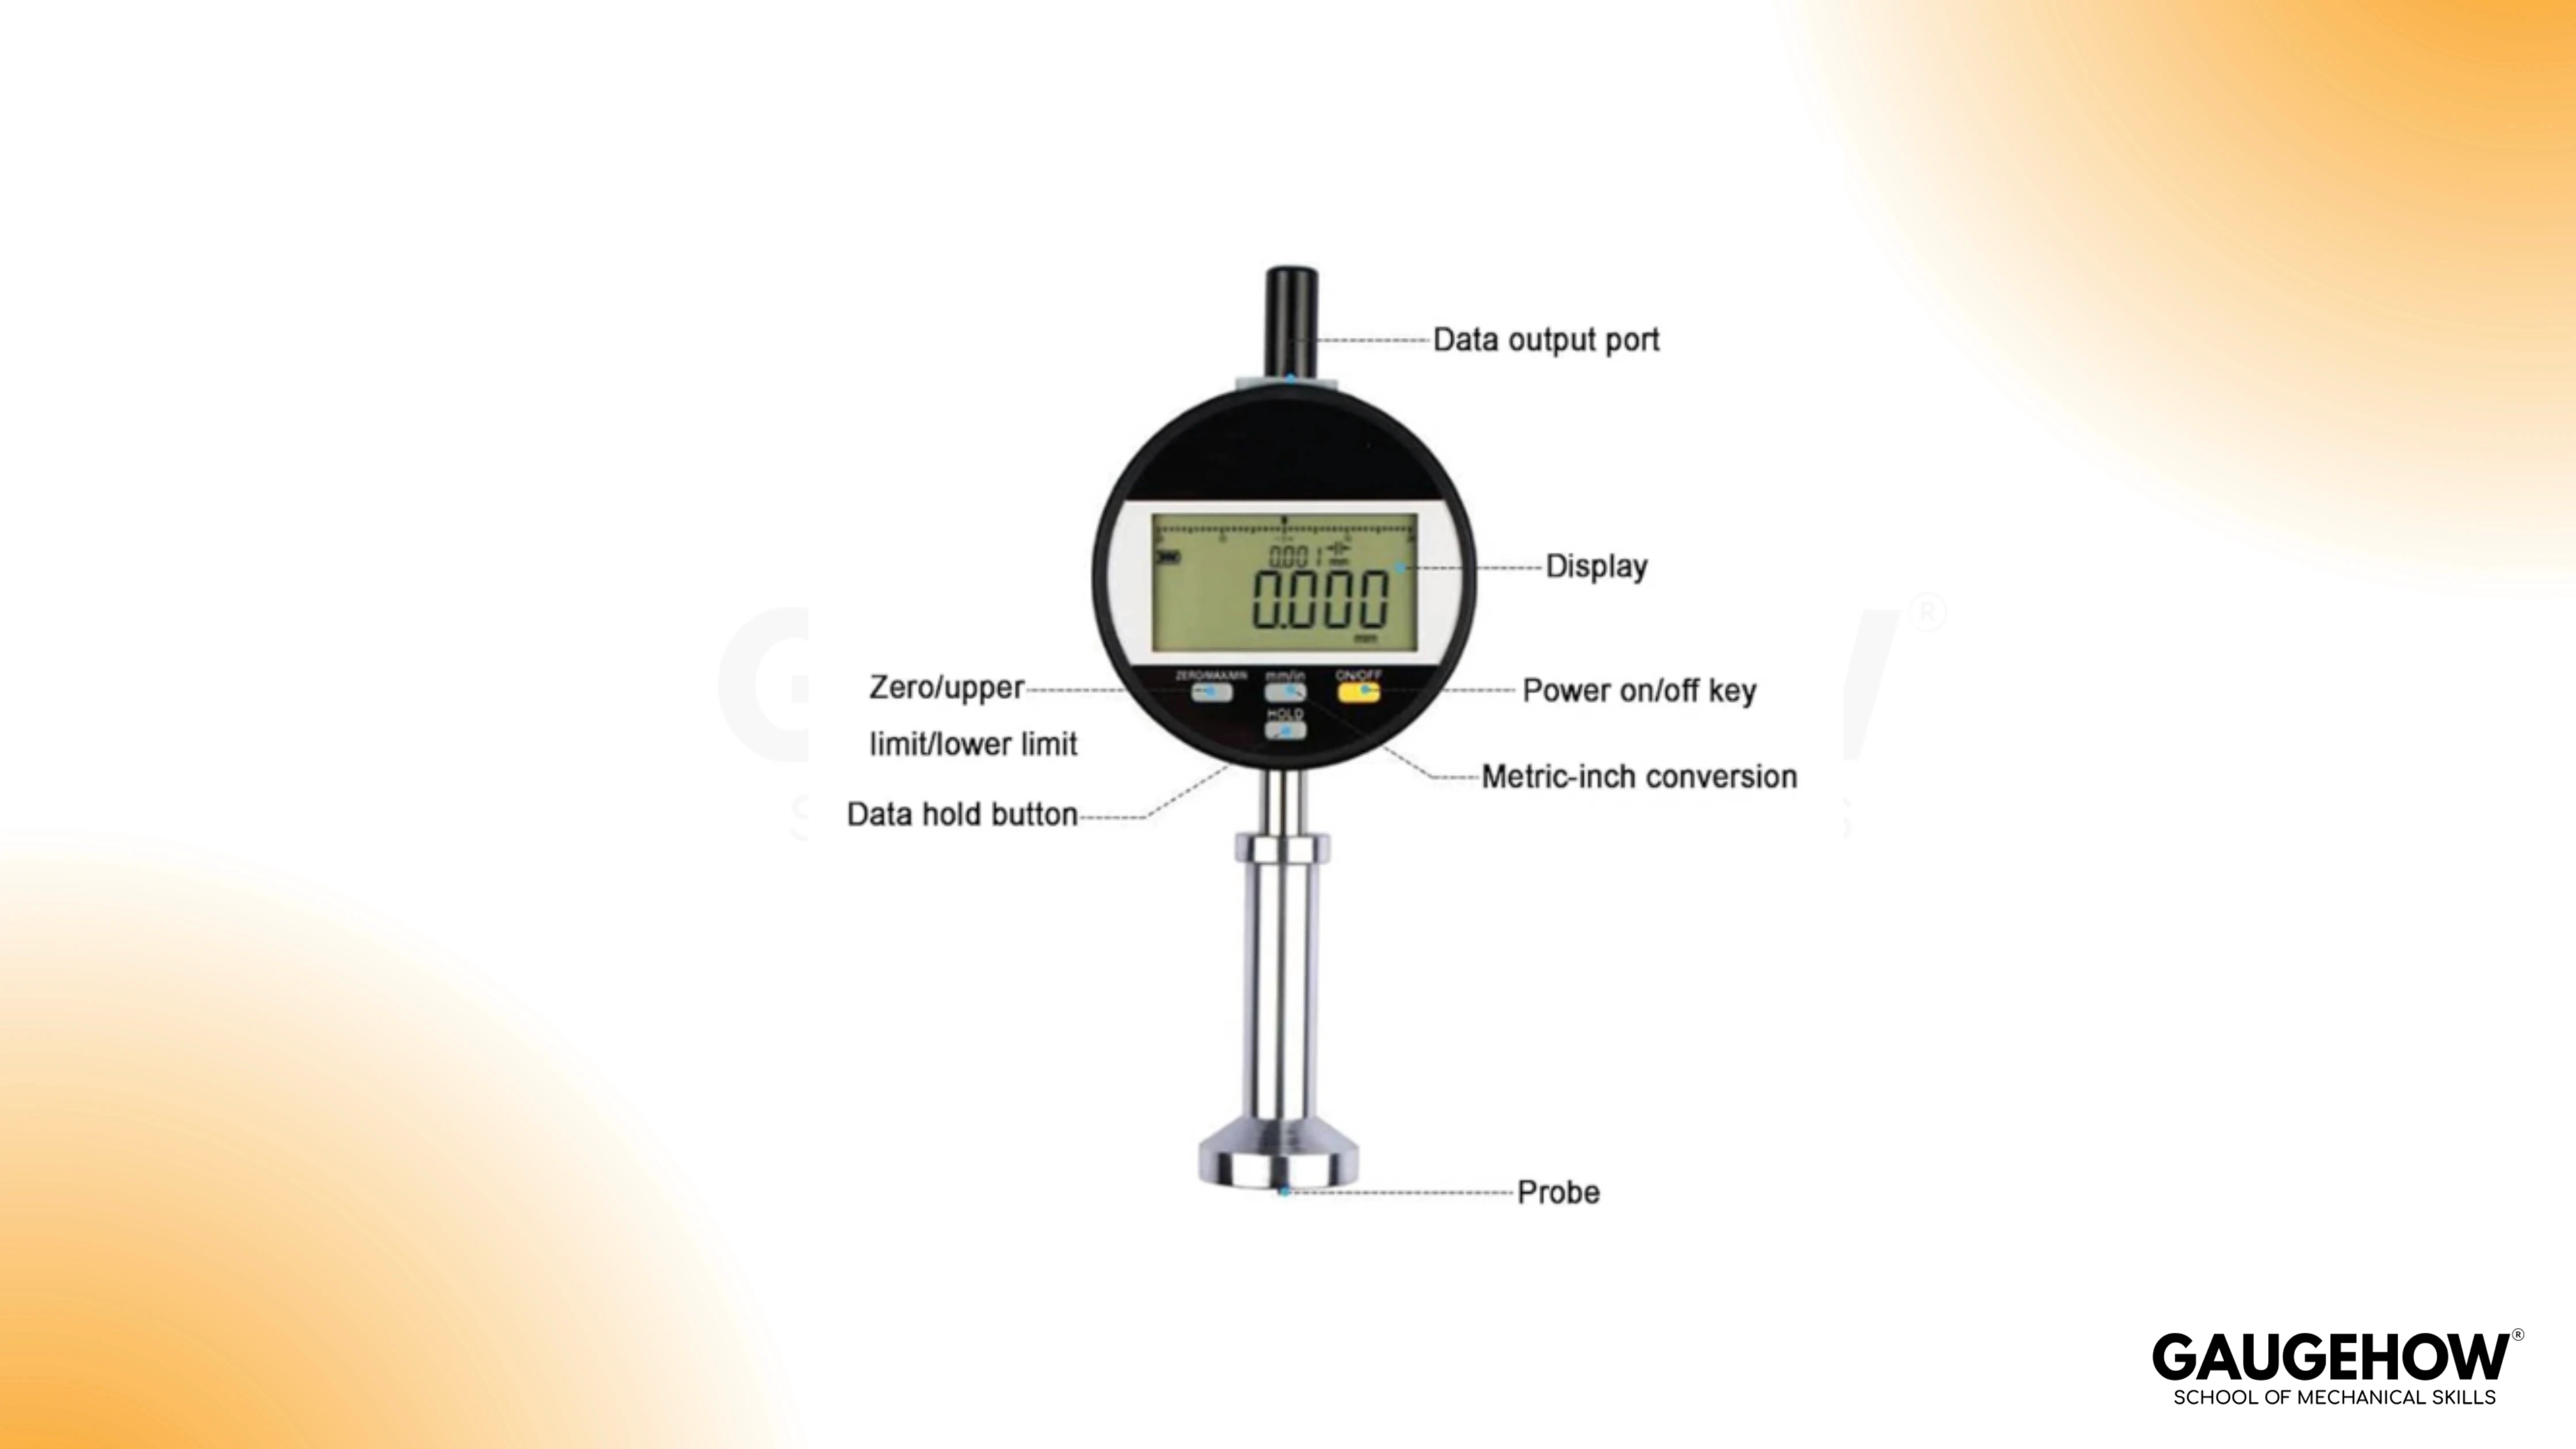
Fast acceptance checks near the process. Confidence rises only when the sampling plan is stable, because one quick trace can pass while the lot varies.
2. Portable Optical Unit
Useful for touch-sensitive surfaces and fine features on the floor. Mode selection and area selection must be consistent, or the number drifts across operators.
3. Benchtop Stylus Profiling Setup
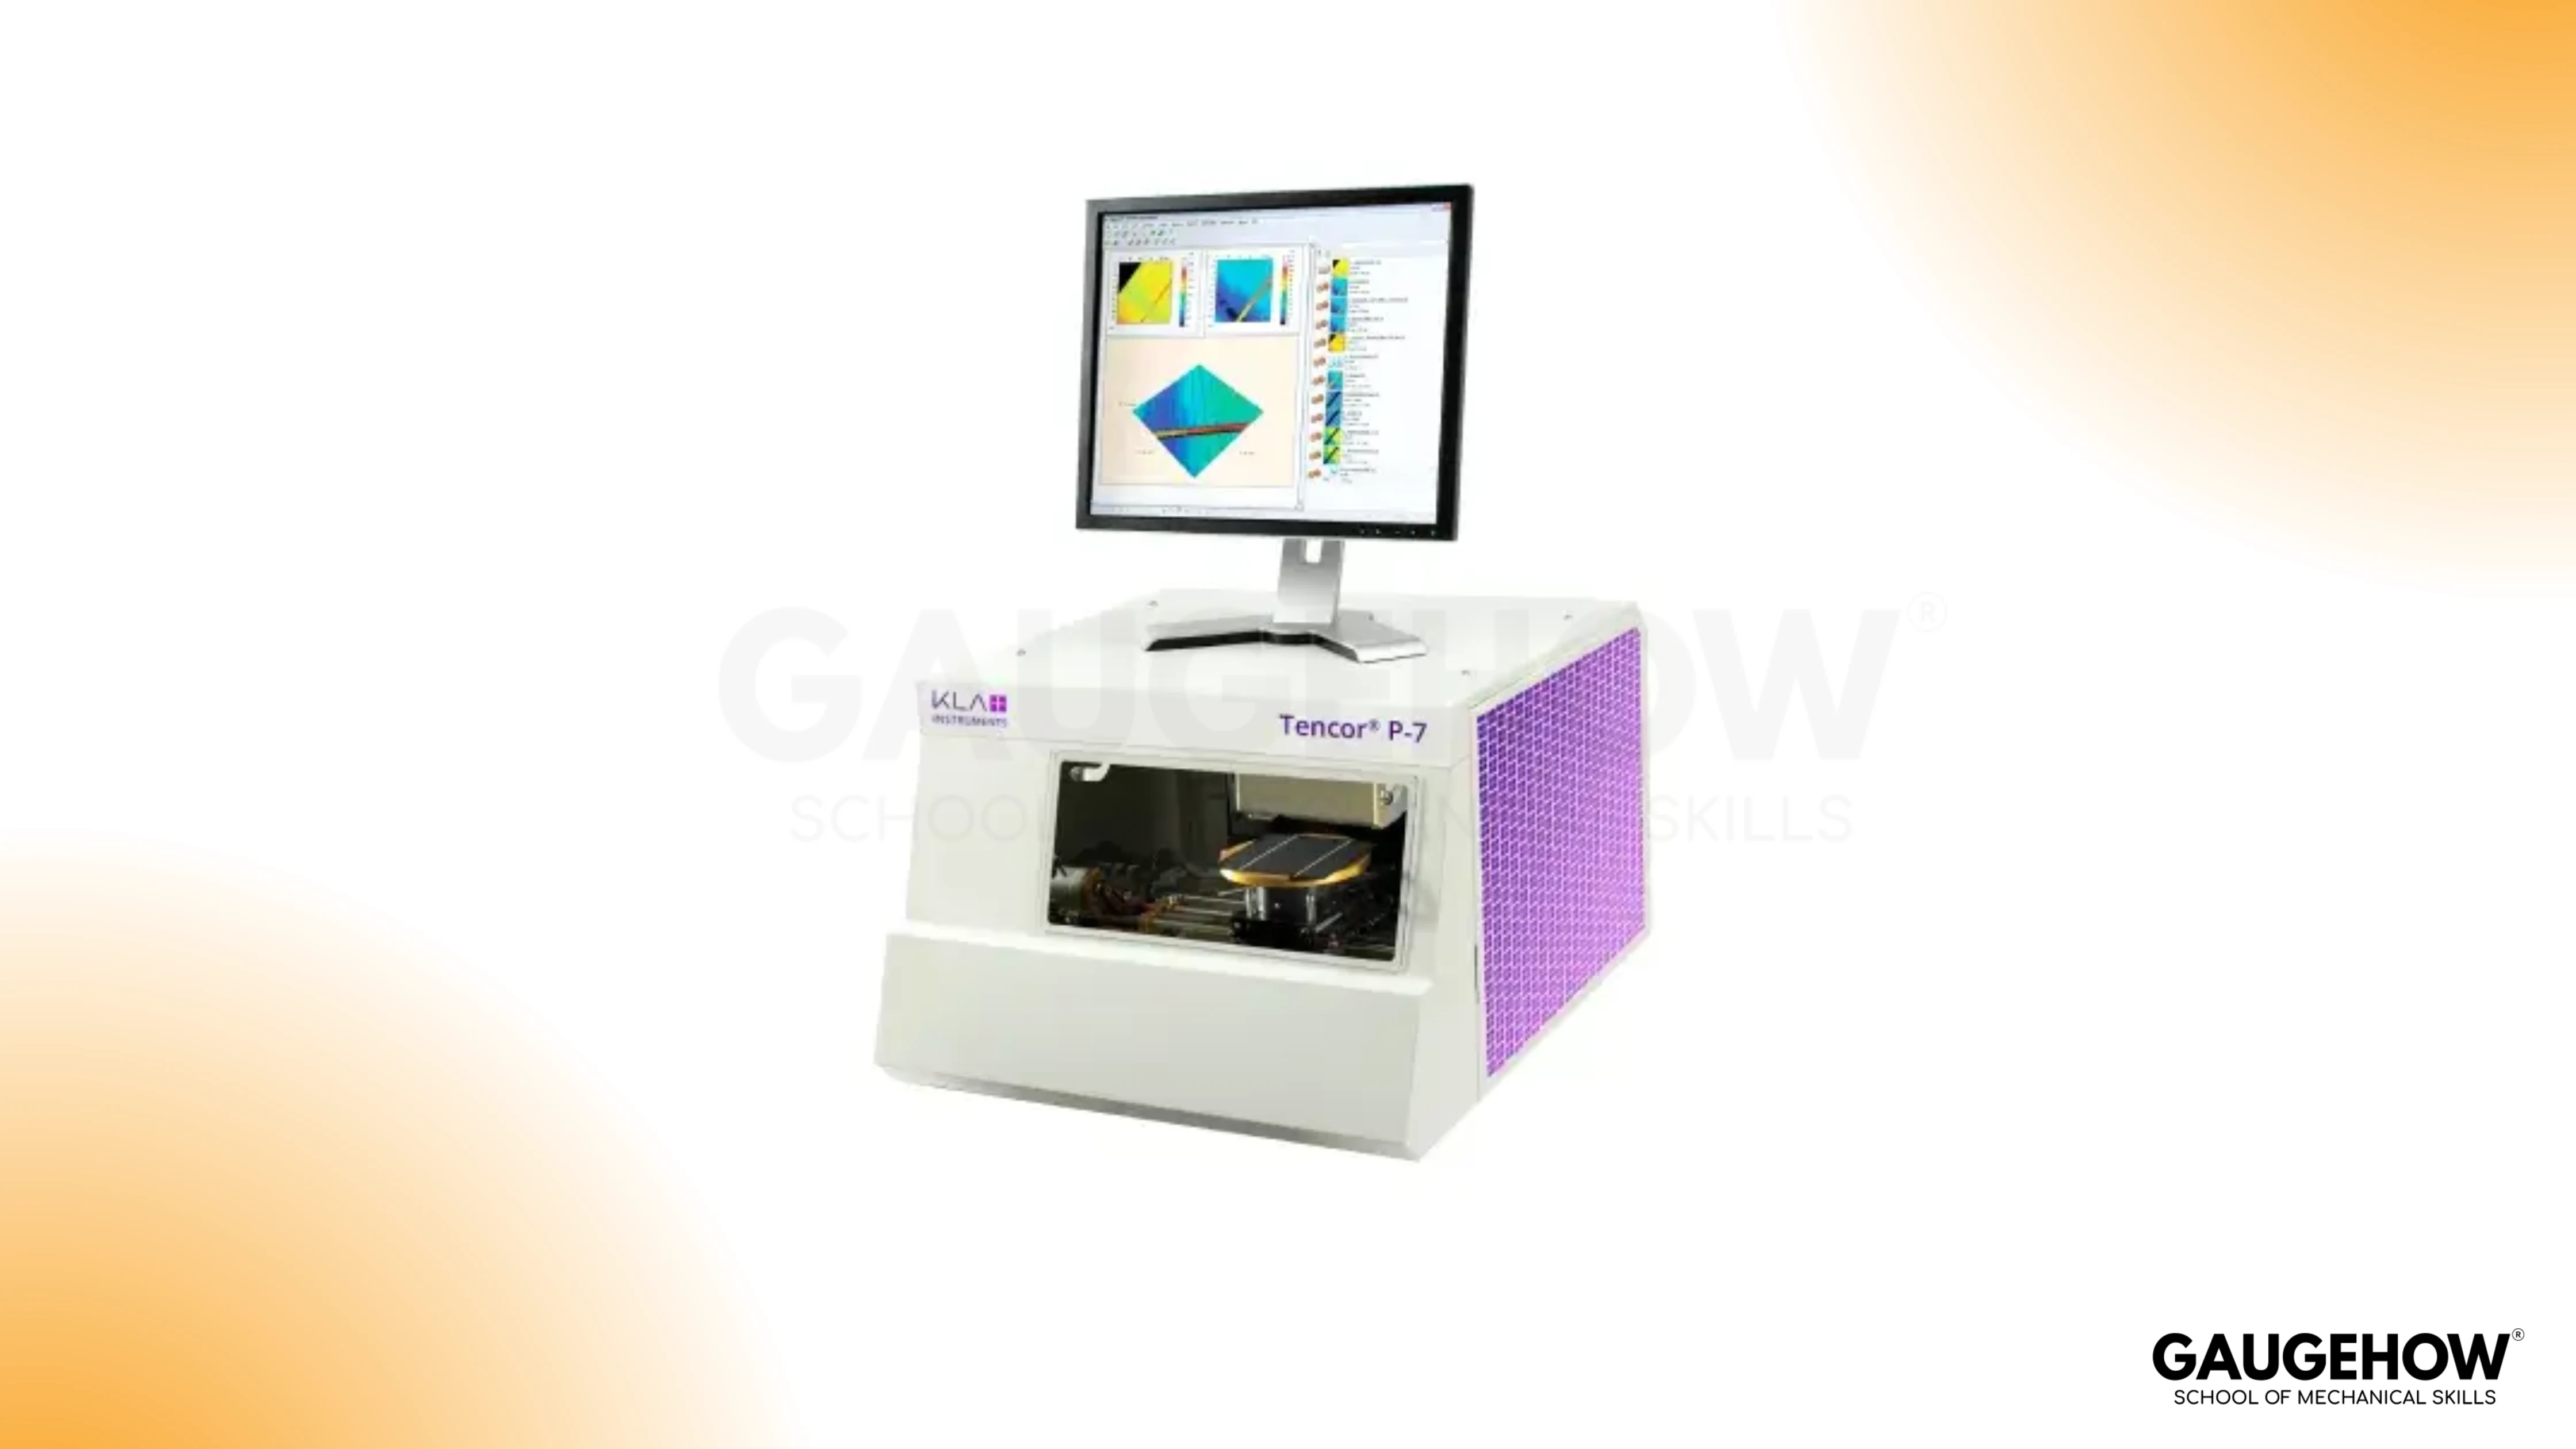
Strong when a trace needs to be defended. A rigid fixture and a written trace strategy reduce disputes when tolerances tighten.
4. Benchtop Optical Mapping Setup
Strong for surfaces where contact is risky or where area behavior matters. Setting up discipline matters most because optics can be sensitive to surface films and reflectivity.
Inside Surface Roughness Tester Types, screening, and investigation are different jobs. Screening prevents escapes. Investigation prevents arguments.
Roughness Tester Vs Profilometer
Teams rarely lose time because of the label. Time gets burned because the expected deliverable was never defined.

A “roughness tester” often means a production-friendly checker that outputs parameters quickly.
A “profilometer” often means a measurement approach that produces a defensible profile or map plus tighter control over evaluation settings.
The practical difference shows up during disagreement. When an acceptance call must be defended, the report needs enough evidence to repeat the measurement.
In Roughness Tester Vs Profilometer conversations, the winning move is to define deliverables first. “Number only” invites disputes. “Number plus method record” survives audits and supplier pushback.
Instrument Behaviors that Change Readings
Trace direction is part of the spec.
Direction changes what the stylus “sees” because the lay interacts with the tip differently. Measuring across the machining pattern usually exposes peaks and valleys more aggressively than running along it, so two labs can both be “right” and still disagree.
The sampling plan is your evidence.
Sampling changes your confidence because one trace in one spot is a weak claim on a variable process. Confidence rises when you cover the functional area and repeat the same locations and count every time.
Instrument settings define the number.
Settings change the reported value even when the part is unchanged, because filtering and evaluation act like a lens on the profile. Cutoff length is the classic dispute trigger since different cutoffs can create two valid readings that are not comparable.
Surface condition must match the inspection.n
Surface condition changes the contact because the probe responds to what’s physically present at the interface. Oil film, debris, or smeared material can lift the sensor off the true surface and soften or distort the profile.
Oxidation haze can do the same, especially on fine finishes where the signal is small. Record the condition at measurement so a second check isn’t unknowingly performed on a different surface state.
🔧 Trusted by 23,000+ Happy Learners
Industry-Ready Skills for Mechanical Engineers
Upskill with 40+ courses in Design/CAD, Simulation, FEA/CFD, Manufacturing, Robotics & Industry 4.0.
Ra Value Measurement
Averaging is powerful because it stabilizes control charts. Averaging is risky because it can hide extremes that drive functional failures. That trade-off is the core of Ra value measurement in acceptance work.
Ra (Arithmetic Average Roughness): Ra is the average absolute deviation from the mean line over the sampling length. It controls overall finish consistency when the surface is fairly uniform.
Rv (Maximum Valley Depth): Rv is the deepest point below the mean line within the sampling length. It protects against valley-driven leakage paths and lubrication issues.
Rp (Maximum Peak Height): Rp is the highest point above the mean line within the sampling length. It protects against proud peaks that scratch or accelerate wear.
Rt (Total Height in Evaluation Length): Rt is the maximum peak-to-valley height across the evaluation length. It catches worst-case extremes, even if they occur once.
Rz (Peak-to-Valley in Sampling Length): Rz is the peak-to-valley height within a sampling length. It flags local extremes that Ra can smooth out.
The decision behind Rz vs Ra surface roughness is simple: If the failure mode is controlled by a few extremes, an average alone is rarely enough evidence.
Repeatability Workflow That Survives QA
Repeatability comes from removing choice. Choice is where drift enters, then drift turns into scrap, rework, and “supplier disagreement” meetings.
Run the Roughness Decision Chain as a workflow: define deliverable, write the constraint, lock the method, lock the parameter, then lock the record.
A later-body reminder belongs here: What is a Surface Roughness Tester becomes a non-issue once the record makes the number repeatable.
A Monday-real failure looks like this:
At 08:45, the cell checks a shaft near the chuck. One trace, along the visible tool marks, preset A, the surface still has a thin coolant film. The value passes.
At 11:30, QA checks the seal land 10 mm from the end face. Three traces, across the pattern, preset B, surface solvent-cleaned and dry. The value fails.
After lunch, a third check happens with a new spot plan, and the number moves again.
Nothing magical happened to the part. Direction changed. Sampling changed. Settings changed. Surface condition changed. A comparable record would have prevented the comparison in the first place.
Mistakes That Create False Pass Or False Fail + Handoff Template
Two common failure patterns drive most pain: invalid comparisons and weak evidence. Keep the corrections operational.
Decision gate:
False pass: a single “good” spot, then the functional area never gets sampled.
False fail: a new direction or a new setting gets compared to an old report as if both were identical.
Supplier dispute: surface condition differed, but the record line never existed.
Audit failure: method and settings were not captured, so repeatability cannot be demonstrated.
Handoff-proof record template
Record Line | Example Wording |
Location plan | “3 traces, 120° apart, 10 mm from end face” |
Direction note | “Arrow toward Chuck, measure across pattern.” |
Settings snapshot | “Preset name + key settings captured in photo.” |
Sampling plan | “3 traces per part, 5 parts per lot.” |
Surface condition note | “Clean and dry, no oil film, no coating damage.” |
FAQ
1) Where does contact vs non-contact surface roughness measurement matter most?
Delicate coatings, fragile edges, micro features, and tight access shift risk toward optical because contact can damage the surface or ride geometry instead of texture. On accessible machined metals where repeatability is the priority, stylus work often holds up better.
2) What makes the same part measure differently between operators?
Most variation enters through location, direction, settings, and surface condition. When any one of those moves, the tool can honestly report a different number. The dispute is rarely the instrument. The dispute is the missing record.
3) How do you choose Rz vs Ra surface roughness on a drawing?
Average control supports stability. Peak-to-valley control supports worst-case risk. When a function fails because of a few extremes, an average can pass a surface that still fails in service.
4) Which single setting creates the biggest silent number change?
Filtering and evaluation choices change what the instrument counts as roughness. That is why settings must match before results are compared.
5) What is the minimum record that prevents most measurement disputes?
Location plan, direction note, settings snapshot, sampling plan, and surface condition note. When those five lines exist, acceptance decisions become repeatable instead of negotiable.


