Six Sigma Green Belt Interview Questions and Answers

Deepak S Choudhary
Learn More in This Video
Subscribe to GaugeHow for More
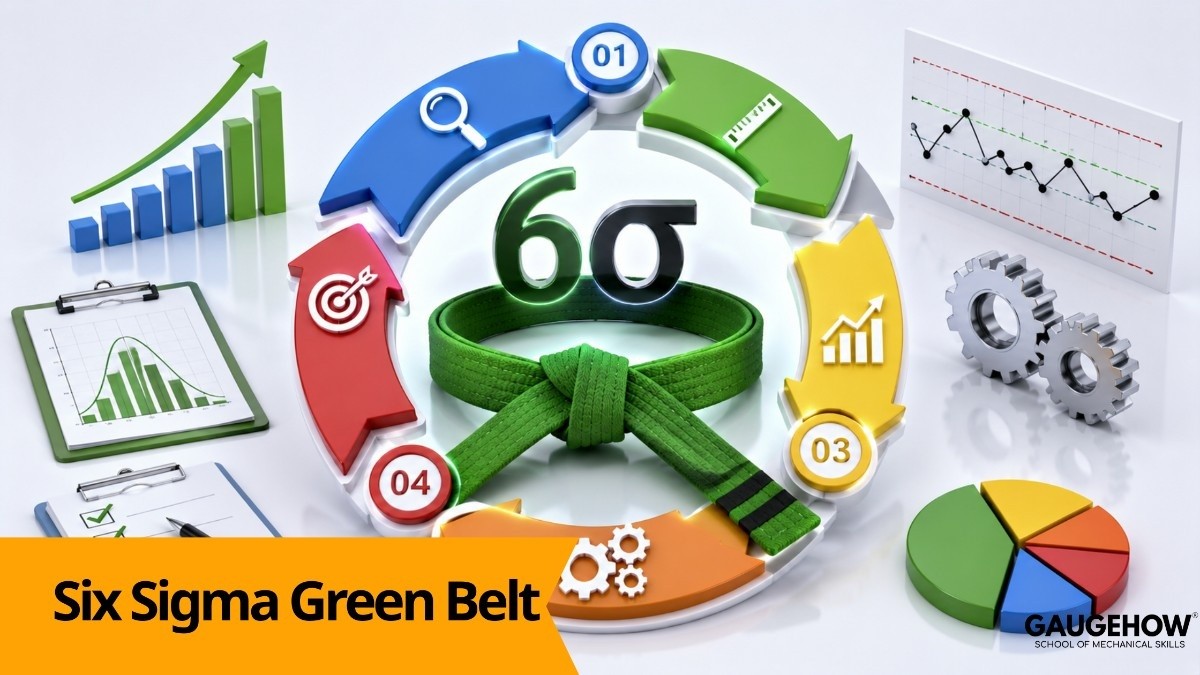
Six Sigma Green Belt interviews test something specific: can you actually apply DMAIC to a real process problem, not just recite what the letters stand for.
Interviewers know the difference between a candidate who memorized definitions the night before and one who's genuinely worked through a project, and they'll usually push past the textbook question with a quick "okay, how would you actually do that" follow-up.
Six Sigma & DMAIC Fundamentals
1. What is Six Sigma, and what does the term "sigma" actually refer to?
Six Sigma is a data-driven methodology for reducing process variation and defects, aiming for near-perfect quality statistically, 3.4 defects per million opportunities at full "Six Sigma" performance.
"Sigma" refers to standard deviation, a statistical measure of variation, and a "Six Sigma" process is one where the specification limits sit six standard deviations away from the process mean.
2. What is DMAIC, and why is it structured as five distinct phases instead of one continuous process?
DMAIC stands for Define, Measure, Analyze, Improve, Control the standard Six Sigma project framework.
It's broken into distinct phases because each one has a different objective and set of tools, and skipping ahead (like jumping to solutions before measuring the actual problem) is one of the most common reasons improvement projects fail to stick.
3. What is the difference between Six Sigma and Lean, and why are they often combined as "Lean Six Sigma"?
Lean focuses on eliminating waste and improving flow/speed through a process, while Six Sigma focuses on reducing variation and defects through statistical analysis.
They're combined because real processes usually have both problems at once waste and inconsistency and addressing only one often leaves the other unresolved.
4. What is a Green Belt's role compared to a Black Belt or Master Black Belt?
A Green Belt typically leads smaller, department-level improvement projects part-time alongside their regular job, applying core DMAIC tools. A Black Belt leads larger, more complex, cross-functional projects full-time and mentors Green Belts.
A Master Black Belt trains and coaches Black Belts and often sets the Six Sigma strategy across an entire organization.
5. What is a defect, and what is the difference between a defect and a defective unit?
A defect is any single instance of a product or process failing to meet a specification one unit can have multiple defects. A defective unit is a unit that has at least one defect and therefore fails overall, regardless of how many individual defects it has.
This distinction matters directly in how DPMO (Defects Per Million Opportunities) is calculated.
Define & Measure Phase Tools
6. What is a Project Charter, and what should it include?
A Project Charter is the founding document of a Six Sigma project, typically including the business case, problem statement, goal statement, project scope, timeline, and team roles.
It exists to get sponsor sign-off and keep the team aligned on what the project is (and isn't) trying to solve before any data collection begins.
7. What is a SIPOC diagram, and when is it used in a project?
SIPOC stands for Suppliers, Inputs, Process, Outputs, Customers a high-level map of a process used early in the Define phase to establish scope and boundaries before diving into detailed process mapping.
It's intentionally high-level, meant to align the team on the big picture rather than document every process step.
8. What is Voice of the Customer (VOC), and how does it connect to Critical to Quality (CTQ) characteristics?
VOC is the process of capturing what customers actually need and expect, gathered through surveys, complaints, interviews, or direct feedback.
CTQs are the specific, measurable characteristics derived from that VOC data that the process must hit to satisfy the customer VOC tells you what matters, CTQs translate that into something you can actually measure and control.
9. What is a Measurement System Analysis (MSA), and why is it done before collecting real process data?
MSA evaluates whether your measurement system itself the gauge, the person measuring, the method is accurate and consistent enough to trust the data it produces.
Skipping MSA risks basing an entire project on data that's actually measurement noise rather than real process variation, which is why it's a standard early Measure-phase step. This is the same discipline covered hands-on in GaugeHow's Engineering Metrology & 3D Measurement course.
10. What is Gage R&R, and what do the "R" and "R" stand for?
Gage R&R stands for Repeatability and Reproducibility Repeatability measures how consistent one person's measurements are on the same part, and Reproducibility measures how consistent measurements are between different people measuring the same part.
A poor Gage R&R result means the measurement system itself needs fixing before trusting any downstream analysis.
Analyze Phase & Statistical Concepts
11. What is the difference between common cause and special cause variation?
Common cause variation is the normal, expected variation inherent to a stable process always present, and generally requires a fundamental process change to reduce.
Special cause variation comes from an identifiable, external, unusual event a specific cause you can often trace and eliminate directly, without redesigning the whole process.
12. What is a control chart, and how does it help distinguish common cause from special cause variation?
A control chart plots process data over time against statistically calculated upper and lower control limits, based on the process's own natural variation.
Points falling outside those limits, or unusual patterns within them, signal special cause variation worth investigating points staying within limits with no pattern suggest the process is simply showing its normal, common cause variation.
13. What is a hypothesis test, and what's the difference between a null hypothesis and an alternative hypothesis?
A hypothesis test is a statistical method for deciding whether observed data provides enough evidence to support a claim about a process.
The null hypothesis typically states there's no difference or no effect, while the alternative hypothesis states there is one the test determines whether you have enough evidence to reject the null hypothesis in favor of the alternative.
14. What is a p-value, and what does a p-value of 0.03 actually tell you?
A p-value is the probability of observing your data (or something more extreme) if the null hypothesis were actually true.
A p-value of 0.03 means there's only a 3% chance of seeing this result by random chance alone if there were truly no real effect, which is typically low enough (below the common 0.05 threshold) to reject the null hypothesis.
15. What is a Fishbone (Ishikawa) diagram used for, and how is it structured?
A Fishbone diagram organizes potential root causes of a problem into categories commonly Man, Machine, Method, Material, Measurement, and Environment (the "6 Ms") branching off a central spine pointing to the effect being investigated.
It's a brainstorming tool used to generate and organize root-cause hypotheses before they're validated with real data.
16. What is the 5 Whys technique, and what's its main limitation?
5 Whys is a root-cause technique where you repeatedly ask "why" about a problem, typically five times, until you reach an underlying root cause rather than stopping at a surface symptom.
Its main limitation is that it relies entirely on the team's existing knowledge and can lead to an oversimplified single-cause conclusion for problems that actually have multiple contributing causes.
17. What is process capability (Cp and Cpk), and what's the difference between the two?
Process capability measures how well a process's natural variation fits within its specification limits.
Cp compares the spread of the process to the specification width without considering whether the process is centered, while Cpk accounts for centering a process can have a good Cp but a poor Cpk if it's capable in spread but shifted off-target.
Improve & Control Phase Tools
18. What is Design of Experiments (DOE), and why is it more efficient than changing one variable at a time?
DOE is a structured method for testing multiple process variables simultaneously to understand their individual and combined effects on an outcome.
It's more efficient than one-variable-at-a-time testing because it can reveal interactions between variables cases where two factors together produce an effect that testing them separately would completely miss using fewer total experimental runs.
19. What is FMEA, and what do the Severity, Occurrence, and Detection ratings represent?
FMEA (Failure Mode and Effects Analysis) is a structured method for identifying potential failure points in a process before they happen.
Severity rates how bad the impact would be, Occurrence rates how likely the failure is to happen, and Detection rates how likely you are to catch it before it reaches the customer multiplied together, they produce a Risk Priority Number used to prioritize which failure modes to address first.
20. What is a Pilot in the Improve phase, and why run one before full implementation?
A pilot is a small-scale test of a proposed solution in a limited, controlled setting before rolling it out across the entire process or organization.
It's done to validate that the improvement actually works as expected and to catch unintended side effects, without the cost and risk of a full-scale rollout that then needs to be undone if something goes wrong.
21. What is a Control Plan, and why is it the key deliverable of the Control phase?
A Control Plan documents exactly how the improved process will be monitored going forward which metrics are tracked, how often, by whom, and what action to take if the process drifts out of control.
It's the key deliverable because without it, process improvements tend to erode back toward the old baseline once project attention moves elsewhere a pattern often called "backsliding."
22. What is Statistical Process Control (SPC), and how does it fit into the Control phase?
SPC is the ongoing use of control charts and statistical monitoring to keep a process stable after improvements are implemented, catching special cause variation early before it produces defects.
It's the practical, day-to-day mechanism that makes a Control Plan actually work, rather than the plan just sitting in a document unused.
23. What is Poka-Yoke, and how is it different from simply training operators to be more careful?
Poka-Yoke means mistake-proofing designing a process or fixture so an error is physically impossible or immediately obvious, rather than relying on human attention to prevent it.
It's more reliable than training alone because it removes the dependency on a person remembering to be careful every single time, which inevitably fails eventually under fatigue or distraction.
Lean Six Sigma Concepts
24. What are the 8 wastes in Lean (often remembered by the acronym DOWNTIME)?
DOWNTIME stands for Defects, Overproduction, Waiting, Non-utilized talent, Transportation, Inventory, Motion, and Extra-processing. Identifying which of these wastes shows up in a given process is often one of the first practical exercises in a Lean Six Sigma project, since most processes have more than one waste type present at once.
25. What is Value Stream Mapping (VSM), and what does it help a team see that a regular process map doesn't?
VSM maps the entire flow of material and information through a process, explicitly separating value-added time from non-value-added time (waiting, rework, unnecessary movement) at each step. A regular process map shows what happens;
VSM specifically highlights where time and value are being lost, which is what makes it a Lean-specific tool rather than a general flowchart.
26. What is 5S, and what do the five S's stand for?
5S is a workplace organization method: Sort, Set in Order, Shine, Standardize, and Sustain. It's often one of the first Lean tools applied in a project because a disorganized workspace makes almost every other kind of waste searching, waiting, unnecessary motion worse, so cleaning it up first makes subsequent improvements more visible.
GaugeHow's 5S System course covers each of the five steps in practical detail.
27. What is Takt Time, and how is it different from Cycle Time?
Takt Time is the rate at which a product needs to be completed to meet customer demand, calculated as available production time divided by customer demand.
Cycle Time is the actual time it currently takes to complete one unit through the process. Comparing the two tells you whether your process is currently faster or slower than what the customer actually needs.
Roles, Certification & Scenario Questions
28. As a Green Belt, if your data analysis shows the root cause is a management or policy decision rather than a shop-floor issue, what do you do?
You escalate it clearly in your project findings rather than trying to solve it yourself, since a Green Belt's scope and authority typically doesn't extend to changing organizational policy.
Presenting the data-backed finding to your project sponsor or leadership, with a recommended direction, is the correct next step not quietly dropping the finding because it's outside your comfort zone.
29. You're asked in an interview to describe a Six Sigma project you led, but you're a fresher with no real project experience yet. What's a strong way to answer?
Be upfront that you're applying certification knowledge without live project experience yet, then walk through a practice project, a coursework case study, or even a personal-life example (like reducing a process's variation at home or in a student activity) using proper DMAIC structure.
Interviewers are often more interested in whether you can structure the thinking correctly than whether the example is a real corporate project. GaugeHow's 7 QC Tools course .
nufacturing Tools course are good places to build practice case studies from if you need material to reference.
30. An interviewer asks: "The data shows the process is in statistical control, but the customer is still complaining about quality. How do you explain that?"
Being "in control" only means the process is stable and predictable relative to its own historical variation it says nothing about whether that stable output actually meets the customer's specification.
A process can be perfectly in control while still being incapable, meaning centered and consistent but simply not good enough, which is exactly why control and capability are evaluated as two separate questions.
Frequently Asked Questions
Do I need real project experience to pass a Six Sigma Green Belt interview?
Not always many entry-level roles expect certification knowledge and structured DMAIC thinking rather than a portfolio of completed projects, especially for freshers.
Being honest about your experience level while demonstrating you understand the framework correctly usually matters more than having a long project history.
What's the most common mistake candidates make in Six Sigma interviews?
Reciting definitions without connecting them to how a tool is actually used in a real DMAIC phase for example, defining a control chart correctly but not being able to explain what you'd do if a point fell outside the control limits.
Practicing the "what would you do next" follow-up for each tool closes this gap quickly.
Is Minitab knowledge expected for a Green Belt interview, or just the statistical concepts?
It depends on the role some interviews stay conceptual, while quality-engineering-heavy roles may ask if you're comfortable running a hypothesis test or control chart in Minitab specifically, since it's the software most Six Sigma training is built around.
Mentioning hands-on Minitab familiarity, even from coursework, is a solid addition if you have it.
How much statistics knowledge does a Green Belt actually need compared to a Black Belt?
Green Belts need working familiarity with core tools hypothesis testing, control charts, basic capability analysis while Black Belts are expected to go deeper into advanced DOE, regression, and multivariate analysis. If you're prepping for a Green Belt interview specifically, Category 3 above covers roughly the right depth.
Conclusion
Six Sigma Green Belt interviews consistently circle back to one core skill: can you walk a real (or realistic) problem through Define, Measure, Analyze, Improve, and Control, using the right tool at the right phase, and explain your reasoning as you go.
The 30 questions above cover exactly that sequence, plus the Lean concepts and scenario-based judgment calls interviewers use to separate memorized answers from genuine understanding.
To build this understanding from the ground up, GaugeHow's Basics of 6 Sigma course covers the full DMAIC framework hands-on. Pair it with the 7 QC Tools course and Lean Manufacturing Tools course for the practical tools every Green Belt project leans on, and the 5S System course if your role also touches workplace organization alongside statistical quality work.